Ability to display appropriate category labels in graphs with multiple vertical axes
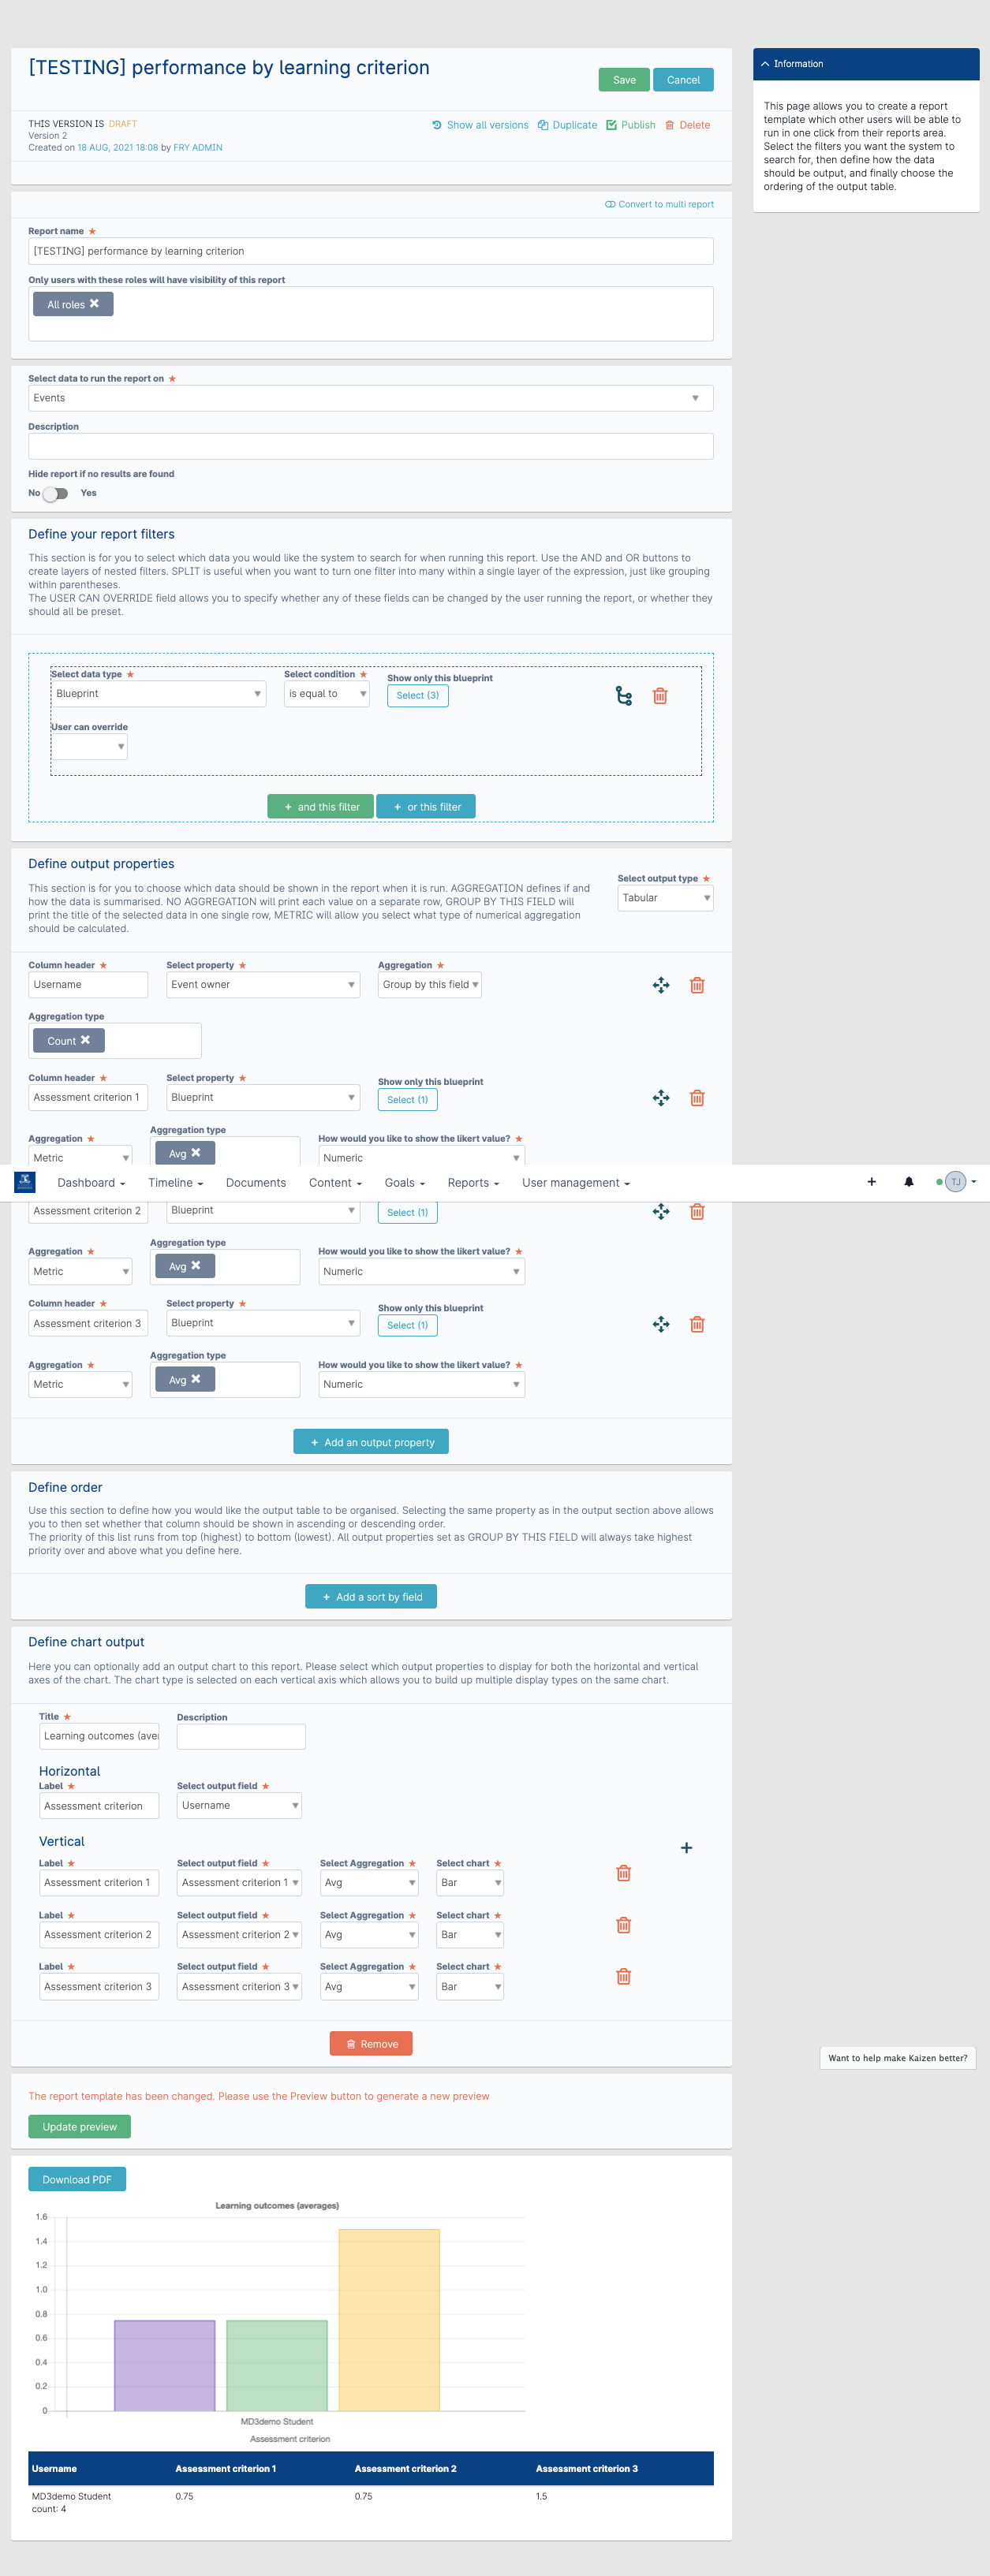
The aim here is to plot a graph of a report that aggregates the values for a series of blueprints (in this each representing a different assessment criterion and using the same Likert scale). For each target user, the report (and the graph) provide an average Likert value for each criterion. The graph presenting this as a series of bars (one per criterion). When defining the chart output this is setup by adding multiple vertical axes (one per criterion/blueprint) as per the attached image. That produces a (sort of) appropriate graph but there is no way to adopt the labels for the vertical axes selections as category/bar labels, which is what is really needed in this case. Plus, the forced selection of an output field for the horizontal axis label/s doesn't really make sense in this context (again, see the attached image, which shows a complete sample report event template to see what I mean).